
Most churches track the big two: Worship Attendance and Weekly Giving. While these are vital indicators of growth, they are lagging indicators. They tell you what happened, but they don’t tell you why.
To understand the trajectory of your ministry, you have to look at the activities driving those numbers: outreach, follow-up, equipping, groups, and serving. At Churchteams, we use a simple framework to visualize this: Outreach (Gray), Assimilation (Orange), and Connection (Blue).
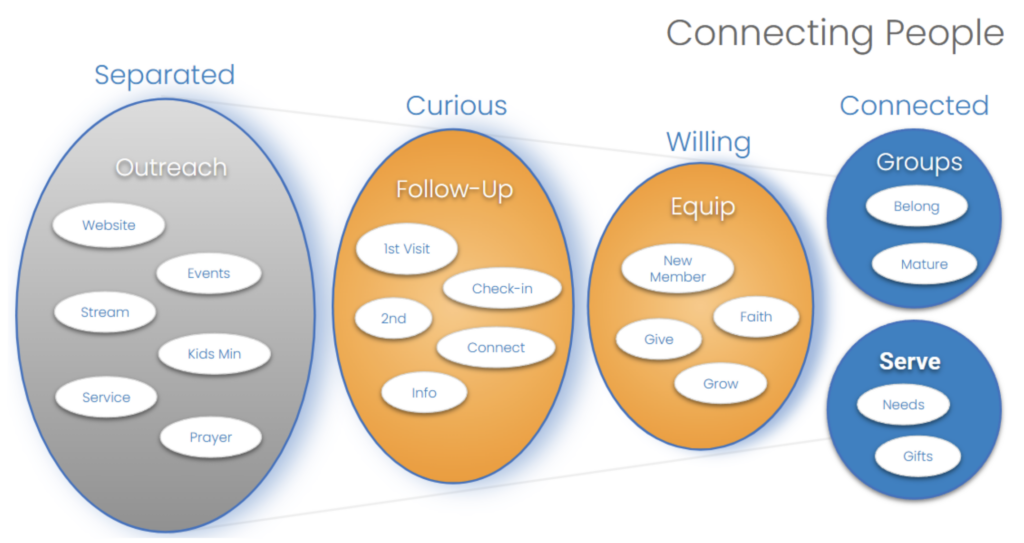
When you align these stages, you discover five “hidden” metrics that reveal the true story of your discipleship process.
What data should a church track to get a true picture of ministry health and growth?
To get a clear view of your church’s “Grey (Outreach), Orange (Assimilation), and Blue (Connection)” stages, you should focus on these five indicators:
First-to-Second Visit Return Rate
Are guests actually coming back? This measures the effectiveness of your first impressions and initial follow-up. We recommend you are using a Digital Connection Card and Text-to-Church, allowing guests to use a simplet text to connect. Learn more: Text-to-Church for “All Check” registration. It allows you to instantly distinguish between 1st-time and returning guests without manual data entry.
Group Attendance Percentage
What share of your total attenders are actually engaged in a small group or Bible Study? Group leaders can capture attendance in the app or via emailed reminders. Churchteams sends you a monthly health report that shows these attendance percentages for all your groups.
Volunteer Engagement Ratio
How broad is your serving base? You want to know if 20% of your people are doing 100% of the work, or if you are successfully utilizing the full body. Automated volunteer reports will help you catch volunteer burnout before it sets in. The same reports can also be used to express gratitude at various milestones, such as the 1st year of service.
Giving Participation Rate
Instead of just looking at the total dollar amount, use Churchteams reports to look at the percentage of active members who give anything. This is a much better church health metric. In addition to our automated reporting, add Giving metrics to your Churchteams home screen so that you always have current information at hand.
Assimilation Timeline
What is the average number of days or weeks from a person’s first visit to their enrollment in a small group? Or to the time they begin serving? A shorter timeline usually indicates a healthy connection process. Custom member attributes in your Church Management Software can track all of the dates for an annual snapshot.
Using These Metrics to Make Better Ministry Decisions
Data should lead to action. When these numbers shift, here is how to respond:
- When visitation rates drop: It’s time to diagnose the guest experience. Is the parking lot confusing? Is the follow-up taking too long?
- When group participation stagnates: Look for barriers to connection. Do you need more “entry-level” groups? Is the registration process too complex?
- When the volunteer pool is thin: Broaden your recruitment and simplify onboarding. Use automated workflows to move people from “interested” to “trained” to “scheduled” without them falling through the cracks.
- Sharing with Elders: Data doesn’t have to feel “corporate.” When sharing these numbers with your board, frame them as Discipleship Milestones. It’s not about the number; it’s about the person and their growth behind the number.
At Churchteams, we offer a Meet The Software Zoom webinar every week using the image above to illustrate what the outreach, assimilation, and connection process looks like. We’d love for you to join the discussion.